Tuesday, January 8, 2008

Merrill Lynch declares we have entered in recession.

David Rosenberg, chief North American economist for Merrill Lynch, announced: "According to our analysis, this [recession] isn't even a forecast any more but is a present day reality."

Marketwatch reports:

"Friday's employment report strongly suggests that an official recession has arrived," Rosenberg wrote in a note to clients on Monday.

"The key question now is how deep the recession will be and how long it will last," wrote Richard Berner and David Greenlaw, economists for Morgan Stanley, in a note to clients on Monday.


According to the Telegraph:

Mr Rosenberg points to a whole batch of negative data to support his analysis, including the four key barometers used by the National Bureau of Economic Research (NEBR) - employment, real personal income, industrial production, and real sales activity in retail and manufacturing.

Mr Rosenberg notes that although the NEBR will be the final arbiter of any recession, such confirmation may be two years away as it typically waits for conclusive evidence including benchmark revisions.

However, he believes that all four of these barometers "seem to have peaked around the November-December period, strongly suggesting that we are actually into the first month of a recession."

The Big Picture posted this graph:


Here are some Rosenberg quotes from the Jay Hancock's blog at the Baltimore Sun:

At no time in the past sixty years has the unemployment rate risen 60 basis points (50 bps is the actual cutoff) from the cycle low without the economy slipping into recession, and here we now have the jobless rate hitting 5% in December versus the March/07 trough of 4.4%.

Aggregate hours worked in the economy contracted at a 0.4% annual rate in 4Q, and this comes on the heels of a 0.6% decline in 3Q. Back-to-back declines in total hours worked have always been associated with recession.


The level of unemployment is up 13% YoY, again a development that has always been consistent with past recessions. The YoY rate of change in the level of the unemployed who have been idle for at least 15 weeks is particularly ominous - +20%, which is a pace that prevailed in the early stages of prior economic downturns (hitting this trend in April/01 and in Aug/90 when the recessions were one-month old).

And we have Household Employment contracting 49,000 in 4Q and the YoY trend lowing to +0.2% in December from +2.2% a year ago, another classic recession signal. Consider for a second that in March of 2001 that trend was running at +0.8%, and in July of 1990 the pace was +1.1% - those two months represented the onset of a technical recession and yet the trend in Household jobs is weaker now than it was then.

Sphere: Related Content

Tuesday, January 8, 2008


photo by powderruns


"I am concerned that developments on the inflation front will make the Fed’s policy decisions more difficult in 2008. Recent data suggest that inflation is becoming more broad-based. Recent increases do not appear to be solely related to the rise in energy prices. Consequently I see more worrisome signs of underlying price pressures…"


In the news:

The National Association of Realtors' Pending Home Sales Index, fell 2.6% percent in November, after two months of improvement from a record low hit in August. Economists surveyed by Briefing.com had forecast a 0.8% decline.

James Cayne to step down as Bear Stearns CEO. Yesterday, its shares were at $76.25, below their 52-week high a year ago of $172.61.

Moody's Investors Service downgraded the ratings of 46 tranches from eight Alt-A deals issued by Bear Stearns (BSC) in 2007.

Sphere: Related Content

Monday, January 7, 2008

Residential Investment and Recessions

Calculated Risk has a great post on some of the components of GDP and their relation to recessions.

His first chart looks at Private Fixed Investment. You can click on it for a larger image. Private Fixed Investment vs. GDP He notes that “Private fixed investment has fallen 13 times since 1948 (14 including the current slump), with only 10 recessions.” He comments that in the dips in 1951, 1967, and the minor slump in 1986, private investment fell, but the economy didn't slide into recession. However, each time was accompanied with a surge in defense spending with the Korean war, the Vietnam war, and the general defense build-up with the Cold War.


Here is a chart with Defense Spending.The Defense Spending in the first quarter of 1951 through the second quarter of 1952 was off the chart (65% in the first quarter, 98%, 118%, 111%, 75%, and 47% in the 2nd quarter of 1952).
Calculated Risk points out that “the year-over-year change in private fixed investment appeared to have bottomed in early 2007, suggesting the economy might have avoided a recession”. Currently our Defense spending is up helping to cushion the drop in fixed investment. But Defense spending is not up at the high levels it was at during the previous wars.

Calculated Risk created a second graph separating private fixed investment into residential and nonresidential components. Residential and Non-Residential Investment He illustrates that in general “residential investment leads nonresidential investment.” If residential investment continues to fall, it suggests that nonresidential fixed investment would also fall.

Calculated Risk also has good charts on residential investment compared to equipment and software investment and also compared to structures. Both those components of GDP tend to lag residential investment.


Edward Leamer, a Professor at UCLA, presented “Housing is the Business Cycle” at the Housing, Housing Finance, and Monetary Policy Symposium sponsored by the Fed in August 2007. In his presentation, he noted some of the same dynamics.


“Residential investment consistently and substantially contributes to weakness
before the recessions, but business investment in equipment and software does
not. And the recovery for residences begins earlier and is complete earlier than
the recovery for equipment and software.”

Residential investment “contributes most to weakness before recessions. In 6 of
the 10 recessions, residential investment was the greatest contributor to
weakness prior to the recession. Only twice of 10 did residential investment not
contribute significantly to weakness prior to the recession: the 1953 and 2001
oddballs. “
Consumer durables, consumer services, and then consumer non-durables were the next significant contributers.


"Equipment and software ranks as the number one source of weakness during the
recessions compared to a rank of six prior to the recessions. In terms of their
impacts during recessions, after business spending on equipment and software
came consumer spending on durable and nondurables."


Leamer said that after residential investment, the next best predictor of recessions is consumer durables and consumer services. Here are graphs of each.


Neither consumer durables or consumer services dipped in the 3rd quarter of 2007. The 4th quarter 2007 GDP figures are due to be released on January 30, 2008.


Sphere: Related Content

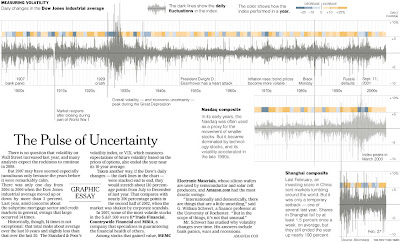
Nice graphic on volatility

2007 may have felt volatile, but it was an average year at most. The New York Times looked at volatility over the last 100+ years. If you want to see what volatility looks like, look at the chart on the Shanghai composite. You can click on the picture to go to the NY Times Article.


NY Times Graphic

Sphere: Related Content

Monday, January 7, 2008


photo by mrhappy

Subprime: The official word of the year for 2007.

American Dialect Society


In the news:


Iranian ships "harass" U.S. ships.

Sphere: Related Content

Thursday, January 3, 2008

The auto numbers are in for 2007

The automakers announced their 2007 sales figures. The overall US market sales were down 2.4% to 16,100,000 units. Market share and units were down for the “Big Three”, GM, Ford, and Daimler Chrysler, while the three biggest Japanese automakers, Toyota, Honda, and Nissan, had increases in market share and units. The Japanese automakers have steadily gained market share at the expense of the “Big Three” since the mid 1990s. Even when the “Big Three” had gains in units sold in the late 1990s, they were still losing market share.

Toyota is forecasting a record 1.7 trillion yen (about $15 billion USD profit) for 2007. On the flip side, GM posted a record net loss of $39 billion in the 3rd quarter of 2007 (a lot of that was a accounting chargeoff and not a cash expense). Edmunds.com forecasts U.S. sales of about 15.9 million in 2008, down 200,000 from 2007 which would make 2008 the worst year in a decade.


Here are some charts. You can click on the charts to make them bigger.


Sphere: Related Content

Thursday, January 3, 2008


photo by ccgd


"This market is really gonna fly," Ira Eckstein, president of Area International Trading Corp, said on the NYMEX floor as oil made its record climb.


In the news:

US December ADP private payrolls up 40,000. The Labor Department releases its official figures tomorrow.

Initial jobless claims fall 21,000 to 336,000.

Sphere: Related Content

Wednesday, January 2, 2008

Slowdown in Manufacturing stokes recession fears

According to the Manufacturing ISM Report On Business issued today by The Institute for Supply Management (ISM), the Purchasing Managers' Index (PMI) was at 47.7 down from 50.8 in November and 50.9 in October. Forecasters had expected the December index to hit 51.0. December ended 10 consecutive months of growth in the manufacturing sector.

PMI was developed by the U.S. Department of Commerce (DOC) and the The Institute for Supply Management (ISM) and is part of the Manufacturing ISM Report On Business. The report is released at the beginning of every month reporting data for the previous month. PMI adjusts five components of the Institute's monthly survey and applies weights to calculate a single monthly index number: New Orders, 30%; Production, 25%; Employment, 20%; Supplier Deliveries, 15%; and Inventories, 10%. PMI is an excellent short term economic barometer. According to ISM, there is a close parallel between growth in real Gross Domestic Product (GDP) and PMI. The index explains about 60% of the annual variation in GDP in the last 10 years.

A PMI reading above 50 percent indicates that the manufacturing economy is generally expanding; below 50 percent indicates that it is generally declining. PMI in excess of 41.9 percent, over a period of time, indicates that the overall economy, or gross domestic product (GDP), is generally expanding; below 41.9 percent, it is generally declining. According to ISM, the past relationship between the PMI and the overall economy indicates that the PMI average for January through December (52.2 percent) corresponds to a 3.2 percent increase in real gross domestic product (GDP) annually. In addition, if the PMI for December (47.7 percent) is annualized, it corresponds to a 1.8 percent increase in real GDP annually."

4 of the 5 components were showing the manufacturing economy to be contracting (New Orders, Production, Employment, and Supplier Deliveries). Inventories contracted, but were still above the expansion level.

There seems to be some inflationary concerns in these remarks from some of the respondents in the report:

  • "Have received a large volume of price increase notices in the last month with increases between 3 percent to as much as 15 percent." (Chemical Products)
  • "Business is good, but higher raw material prices are squeezing margins." (Primary Metals)
  • "Upward price of raw materials, plus low inventories, is pushing price of resins skyward." (Plastics & Rubber Products)

Here is a chart of PMI for the last 40 years. 1989 was the only time the index went below 46 without being in a recession. You can click on the chart for a larger view.


Sphere: Related Content

Wednesday, 1/2/08


photo by Mugley


Happy New Year!


In the news today:

Institute for Supply Management (ISM) reported that its December manufacturing index moved to a contractionary 47.7 in November, from 50.8 in November and 50.9 in October. Numbers in the ISM report over 50 indicate growth. Forecasters surveyed by Dow Jones Newswires had expected the December index to hit 51.0.

Gold prices closes at a 28 year high at $857.

Oil hits $100 for the first time.

Sphere: Related Content